Graphing the Tangent Function
Recall that
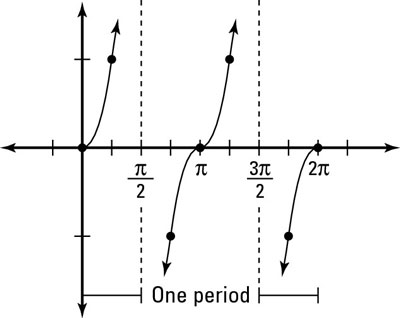
 and cosx has a value of 0 when x= 90°
  or 270°
  . This can create a situation in which the denominator will be zero and therefore undefined when using the tangent function.
The range of tangent x is all real numbers (
 but the domain will have restrictions and will be the set : {x|x ≠
 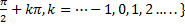 . Wherever x is undefined there will be a vertical asymptote.
Vertical asymptotes are vertical lines which correspond to the zeroes of the denominator of a rational function. Looking at the graph below the vertical asymptotes are represented by the dashed lines. The solid lines of the graph will never cross or touch the dashed lines. Therefore in a single period, tangent x has vertical asymptotes when x =
 and when x =
  .
.
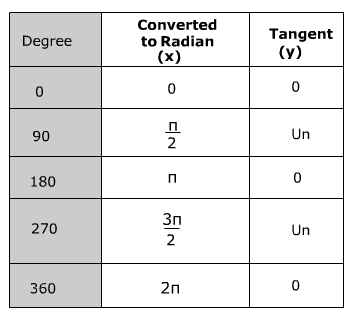
The graph below shows the tangent graph over multiple periods.
Tangent graphs can be used in the field of electronics. For instance, they can be used to explain and illustrate the capabilities of a battery eliminator circuit.
|
Related Links: Math Trigonometry The Cosine Function in Right Triangles The Sine Function in Right Triangles |
To link to this Graphing the Tangent Function page, copy the following code to your site: