The Normal Distribution - Empirical Rule
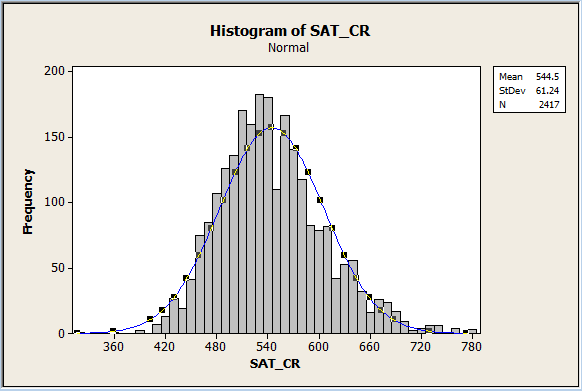
Here is a histogram of SAT Critical Reading scores. The scores create a symmetrical curve that can be approximated by a normal curve, as shown. Notice that we see the characteristic bell shape of this near-normal distribution.
Every normal distribution has a mean and a standard deviation
 . Given any normal distribution, it will be true that mean = median = mode. The curve is symmetric about the mean, which means that the right and left sides of the curve are identical mirror images of each other. Because the right and left sides are mirror images of each other, 50% of the values are less than the mean and 50% of the values are greater than the mean.
The height of a normal distribution is a maximum at the mean, and the height decreases as one goes from the mean toward the right tail, or as one goes from the mean to the left tail. The total area under the curve is 1, or 100%.
When you are given a normal distribution, with a given mean and standard deviation, you can determine important locations on the bell curve by adding standard deviations to the mean and by subtracting standard deviations from the mean.
For example, if you are given information about IQ scores, which are normally distributed, and are told that the mean IQ score is= 100 and that the standard deviationis 15, then you can calculate that an IQ score that is 1 standard deviation above the mean is: .
Similarly, an IQ score that is 1 standard deviation below the mean is:
.
Similarly, an IQ score that is 1 standard deviation below the mean is: . An IQ score that is 2 standard deviations above the mean is:
 . An IQ score that is 2 standard deviations below the mean is:
 .
.
In other words, a person who has an IQ score of 115 has an IQ score that is 1 standard deviation above the mean. A person who has an IQ score of 70 has an IQ score that is 2 standard deviations below the mean. We're about to see that it becomes less and less likely to find values that are farther from the mean than are closer to it. That is, it would be much less likely to find an IQ score that was 3 standard deviations above the mean than to find one that was 2 standard deviations above the mean (or two standard deviations below the mean, for that matter).
This is such an important concept that we have a rule of thumb referred to as the Empirical Rule for normal distributions. In all normal distributions, the Empirical Rule tells us that:
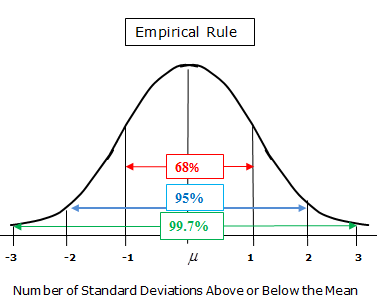
1. About 68% of all data values will fall within +/- 1 standard deviation of the mean.
2. About 95% of all data values will fall within +/- 2 standard deviations of the mean.
3. About 99.7% of all data values will fall within +/- 3 standard deviations of the mean.
Here is a sketch of a representative normal curve, with the Empirical Rule displayed.
Let's assume for a moment that this normal curve was the distribution of the IQ scores of 1,000 high school students. Let's again assume that the mean IQ score of these students is = 100 and that the standard deviation is 15.
Let's consider what this all means. First, the average (arithmetic mean) IQ score of all the students is 100. That is, if you averaged all of the students' IQ scores, you'd see their average IQ score was 100. Second, if is 15, then about 68% of the students had an IQ score in the interval from 85 to 115 since 100 - 15 = 85 and 100 + 15 = 115. In other words, about 680 of the IQ scores of the 1000 students are between 85 and 115. Think about that. Almost 70% of the students have an IQ score that is within 1 standard deviation of the mean. Thus, only about 30% of the IQ scores are outside of being within 1 standard deviation of the mean.
Let's consider how many students' IQ scores fall within 2 standard deviations of the mean. The scores that are two standard deviations of the mean range from 70 to 130 since 100 - 2(15) = 70 and 100 + 2(15) = 130. From the Empirical Rule, we know that about 95% of all students' IQ scores will fall within this range.
Thus, about 950 of the 1,000 students IQ scores fall in this range. This means that out of 1,000 students, we'd expect only 50 students to have an IQ score that is either less than 70 or greater than 130. For example, finding a student with an IQ score of 60 would be highly unlikely. Similarly, finding a student with an IQ score of 140 would be highly unlikely.
Keep in mind that when we have skewed data, there are limitations on how we can analyze the data. For example, we can't use the Empirical Rule for data that come from a skewed distribution. A normal distribution is required to use the Empirical Rule.
Every normal distribution has a mean
and a standard deviation. Given any normal distribution, it will be true that mean = median = mode. The curve is symmetric about the mean, which means that the right and left sides of the curve are identical mirror images of each other. Because the right and left sides are mirror images of each other, 50% of the values are less than the mean and 50% of the values are greater than the mean.The height of a normal distribution is a maximum at the mean, and the height decreases as one goes from the mean toward the right tail, or as one goes from the mean to the left tail. The total area under the curve is 1, or 100%.
When you are given a normal distribution, with a given mean and standard deviation, you can determine important locations on the bell curve by adding standard deviations to the mean and by subtracting standard deviations from the mean.
For example, if you are given information about IQ scores, which are normally distributed, and are told that the mean IQ score is
= 100 and that the standard deviationis 15, then you can calculate that an IQ score that is 1 standard deviation above the mean is:.
Similarly, an IQ score that is 1 standard deviation below the mean is:. An IQ score that is 2 standard deviations above the mean is:. An IQ score that is 2 standard deviations below the mean is:.In other words, a person who has an IQ score of 115 has an IQ score that is 1 standard deviation above the mean. A person who has an IQ score of 70 has an IQ score that is 2 standard deviations below the mean. We're about to see that it becomes less and less likely to find values that are farther from the mean than are closer to it. That is, it would be much less likely to find an IQ score that was 3 standard deviations above the mean than to find one that was 2 standard deviations above the mean (or two standard deviations below the mean, for that matter).
This is such an important concept that we have a rule of thumb referred to as the Empirical Rule for normal distributions. In all normal distributions, the Empirical Rule tells us that:
1. About 68% of all data values will fall within +/- 1 standard deviation of the mean.
2. About 95% of all data values will fall within +/- 2 standard deviations of the mean.
3. About 99.7% of all data values will fall within +/- 3 standard deviations of the mean.
Here is a sketch of a representative normal curve, with the Empirical Rule displayed.
Let's assume for a moment that this normal curve was the distribution of the IQ scores of 1,000 high school students. Let's again assume that the mean IQ score of these students is
= 100 and that the standard deviation is 15.Let's consider what this all means. First, the average (arithmetic mean) IQ score of all the students is 100. That is, if you averaged all of the students' IQ scores, you'd see their average IQ score was 100. Second, if is 15, then about 68% of the students had an IQ score in the interval from 85 to 115 since 100 - 15 = 85 and 100 + 15 = 115. In other words, about 680 of the IQ scores of the 1000 students are between 85 and 115. Think about that. Almost 70% of the students have an IQ score that is within 1 standard deviation of the mean. Thus, only about 30% of the IQ scores are outside of being within 1 standard deviation of the mean.
Let's consider how many students' IQ scores fall within 2 standard deviations of the mean. The scores that are two standard deviations of the mean range from 70 to 130 since 100 - 2(15) = 70 and 100 + 2(15) = 130. From the Empirical Rule, we know that about 95% of all students' IQ scores will fall within this range.
Thus, about 950 of the 1,000 students IQ scores fall in this range. This means that out of 1,000 students, we'd expect only 50 students to have an IQ score that is either less than 70 or greater than 130. For example, finding a student with an IQ score of 60 would be highly unlikely. Similarly, finding a student with an IQ score of 140 would be highly unlikely.
Keep in mind that when we have skewed data, there are limitations on how we can analyze the data. For example, we can't use the Empirical Rule for data that come from a skewed distribution. A normal distribution is required to use the Empirical Rule.
|
Related Links: Math Probability and Statistics Normal Distribution - Simple Probabilities Shapes of Distributions |
To link to this The Normal Distribution - Empirical Rule page, copy the following code to your site: