Function Transformations
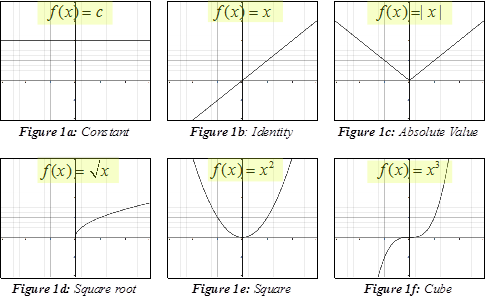
The functions shown above are called parent functions. By shifting the graph of these parent functions up and down, right and left and reflecting about the x- and y-axes you can obtain many more graphs and obtain their functions by applying general changes to the parent formula.
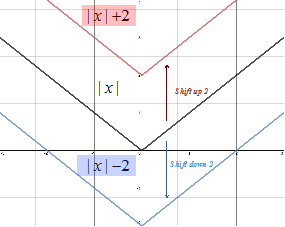
To shift the parent function up or down kunits, add or subtract k to the parent function:
VERTICAL SHIFTS:
f(x) + kShifts up k units
f(x) - kShifts down k units
Let's look at the absolute value function when 2 is added and subtracted from the function.
|
Shift |
-2 |
-1 |
0 |
1 |
2 |
|
|
4 |
3 |
2 |
3 |
4 |
|
|
0 |
-1 |
-2 |
-1 |
0 |
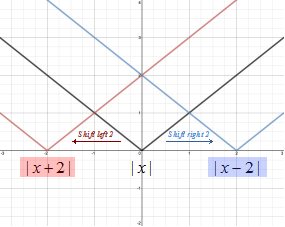
To shift the graph left k units, add k to the value of x. To shift the graph to the right k units, subtract k from x. Notice that to shift to the right requires subtraction from x.
HORIZONTAL SHIFTS:
f(x + k)Shifts up k units
f(x - k)Shifts down k units
Let's look at the absolute value function when 2 is added and subtracted from x.
|
Shift |
-2 |
-1 |
0 |
1 |
2 |
|
|
0 |
1 |
2 |
3 |
4 |
|
|
4 |
3 |
2 |
1 |
0 |
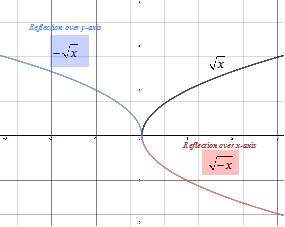
A reflection over the x-axis changes f(x) to -f(x). Reflections over the y-axis changes f(x) to f(-x).
REFLECTIONS:
Reflection over the x-axis
Reflection over y-axis
Let's look at the graphs of the square root function after reflection over the x- and y-axes.
|
Shift |
-2 |
-1 |
0 |
1 |
2 |
|
|
|
|
0 |
-1 |
|
|
|
|
1 |
0 |
|
|
Vertical shifts, horizontal shifts and reflections are called rigid transformation because the shape of the graph is unchanged.
Functions can also be dilated with respect to the y-coordinate or the x-coordinate. These are called non-rigid transformation because they cause a distortion in the graph.
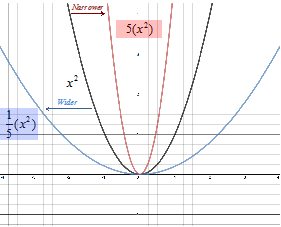
To dilate with respect to the y-axis the function f(x) is multiplied by a constant k. When k > 1 the graph will narrow and when k < 1 the graph will widen.
DILATION OF THE Y-COORDINATE:
k > 1 graph narrows; k < 1 graph widens
Let's look at the graph g(x) = k(x2) when .
|
Shift |
-2 |
-1 |
0 |
1 |
2 |
|
5(x2) |
20 |
5 |
0 |
5 |
20 |
|
|
0.8 |
0.2 |
0 |
0.2 |
0.8 |
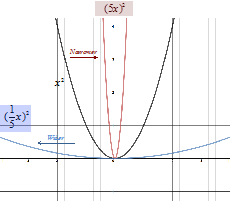
To dilate with respect to the x-axis the x-value is multiplied by a constant k. When k > 1 the graph will narrow and when k < 1 the graph will widen.
DILATION OF THE X-COORDINATE:
k > 1 graph narrows; k < 1 graph widens
Let's look at the graph g(x) = (kx2) when .
|
Shift |
-2 |
-1 |
0 |
1 |
2 |
|
(5x)2 |
100 |
25 |
0 |
25 |
100 |
|
|
0.16 |
0.04 |
0 |
0.04 |
0.16 |
These transformation are summarized below:
TRANSFORMATIONS:
Vertical shifts: Shifts up/down k units
Horizontal shifts: Shifts left/right k units
Reflection: -f(x) Reflection over x-axis
Reflection: f(-x) Reflection over y-axis
Dilation: f(kx) Dilation of x-coordinate k > 1 graph narrows; k < 1 graph widens
Dilation: kf(x) Dilation of y-coordinate k > 1 graph narrows; k < 1 graph widens
Let's look at a couple examples.
|
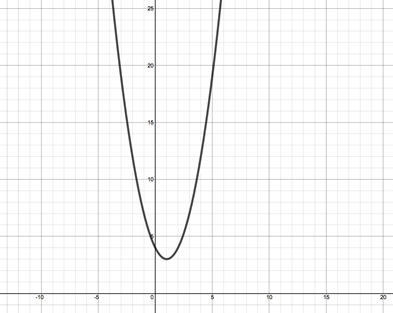
Step 1: Compare the graph to the parent function and determine the shifts that have occurred.
|
The parent function is x2. See Figure 1e above. This graph has been shifted to the right one unit, therefore one has been subtracted from x. The graph has also been shifted up three units, therefore three has been added to the function. Therefore the function of the graph is:
|
|
Step 2: Compare the graph to the parent function and determine the shifts that have occurred.
|
The parent function is . See Figure 1d above. This graph has been shifted to the left four units, therefore four has been added to x. The graph has also been shifted down three units, therefore three has been subtracted from the function. Finally the graph has been reflected about the x-axis and thus the function has been negated. Therefore the function of the graph is:
|

|
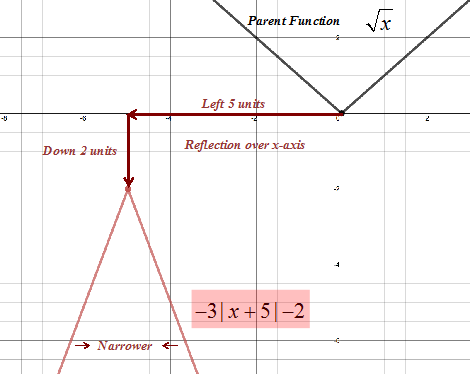
Step 1: Identify the parent function. |
The parent function is . See figure 1c above. |
|
Step 2: Describe the sequence of transformations. |
The graph has been reflected over the x-axis. (Negative at the beginning of the function) The graph has been narrowed by a factor of three. (Three multiplied by the function.) The graph has been shifted five units to the right. (Five is added to x.) The graph has been shifted two units down. (Two has been subtracted from the function.) |
|
Step 3: Sketch the graph.
|
|
|
Related Links: Math algebra Rolle's Theorem The Mean Value Theorem Calculus Topics |
To link to this Function Transformations page, copy the following code to your site: