Graphing Linear Inequalities
Graphing inequalities gives us a picture of all of the solutions. For example, if x>3 , then numbers such as 4, 5, and 6 are solutions, but there are a lot more than these. What about decimals and higher numbers? A graph can give a picture of all these solutions. Here is the graph of x>3 :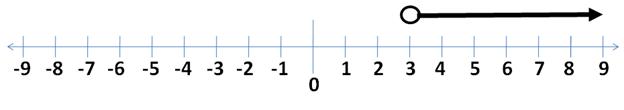 As you can see, there is an arrow above all the numbers three and higher going towards the right. There is an arrow on the end indicating that the answers continue through infinity. Notice that there is an open circle above the 3. This is open to show that the number 3 itself is not a solution (because 3 is not greater than 3), but that the answers start right after 3. Let's consider another example: How would we graph x≤-1 ? Well, let's think what numbers are less than or equal to -1. Is -1 itself a solution? Yes, because the symbol is less than or equal to. Therefore, we are going to put a solid dot above -1 instead of an open circle. This will indicate that -1 itself is a solution. Next, we'll have to decide which way the arrow points. The numbers that are less than -1 are -2,-3,-4, etc., so the arrow will point down to the left. 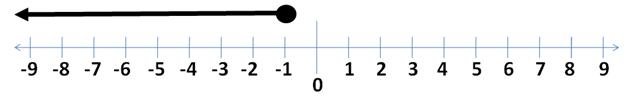 Here is a summary of how to graph inequalities:
1) Draw a number line. 2) Put either an open circle or a closed dot above the number given. For ≤ and ≥ , use a closed dot to indicate the number itself is part of the solution. For < and >, use an open circle to indicate the number itself is not part of the solution. 3) Choose which way the arrow should go.Either think about which numbers would be part of the solution. Or, as long as the variable is listed first, you can just look at the symbol For ≤ and <, the arrow points down to the left. For ≥ and >, the arrow points up to the right. Using this information, let's graph x<6 on a number line. You work it on a separate sheet of paper then check your answer.
1) Draw a number line 2) Should we use a dot or a circle? Answer: Use a circle because the symbol is < , meaning 6 itself is not a solution. Put this circle above the 6. 3) Should the arrow go down to the left or up to the right? Answer: Since the symbol is <, the arrow should go down to the left. Thismakes sense because numbers such as 5, 4, and 3 are less than 6, and those areto the left. Draw your arrow. Does your graph look like this one? 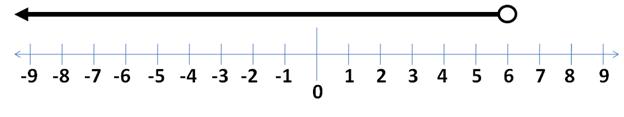 Practice.Graph the following on a separate sheet of paper.
1) x≥4
Answers:2) x<2 3) x>-3 4) x≤-5 5) x>0 1) 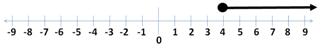 2) 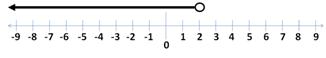 3) 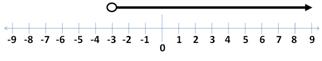 4) 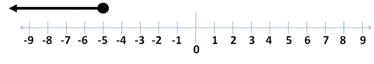 5) 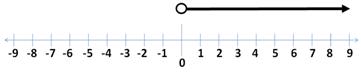 |
|
Related Links: Math Algebra Inequalities Algebra Topics Solving inequalities with addition Solving inequalities with multiplication/division Solving multi-step inequalities Solving Inequalities |
To link to this Graphing Linear Inequalities page, copy the following code to your site: