Stem and Leaf Plot
The Stem and Leaf Plot is an interesting way to showcase data.
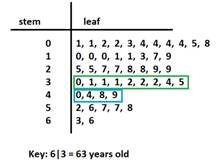
Check out the example showing ages at a birthday party.
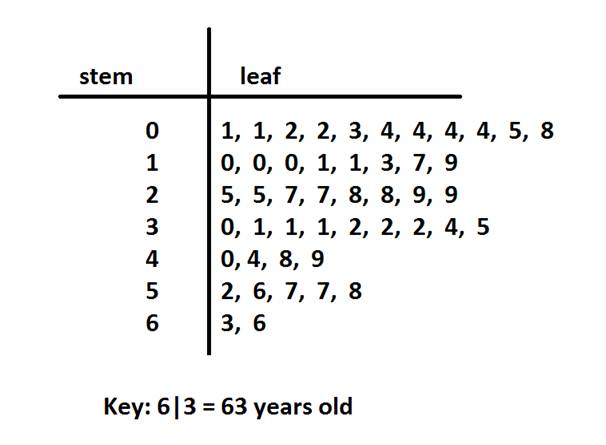
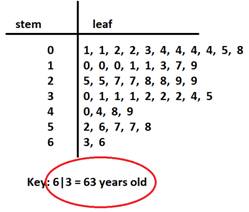
When reading a stem and leaf plot, you will want to start with the key. It will guide you on how to read the other values.
The key on this plot shows that the stem is the tens place and the leaf is the ones place.
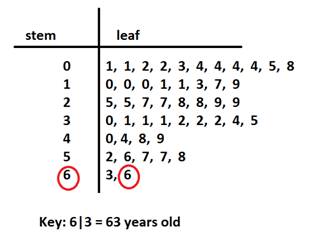
Now we can see that the oldest person at the party is 66 years old.
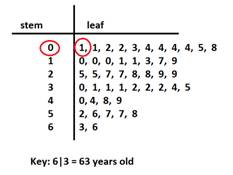
We can also see that the youngest person at the party was 01, or 1 year old.
Stem and leaf plots are similar to horizontal bar graph, but the actual numbers are used instead of bars.
Looking across the rows, we can see that there are 9 people in their 30s and 4 people in their 40s.
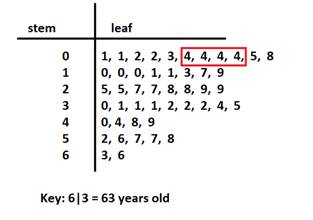
With the numbers ordered on the leaf side of the plot, we can also see that there are 4 children that are 4 years old. This represents the mode because it is the age that appears the most.
We can also easily get the median be finding the middle of the leaves.
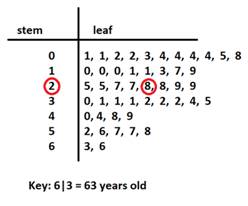
Here we can see that the median is 28 years old. So half the guests are younger than 28 and half are older than 28.
Stem and leaf plots are a great way to visually see what age groups are at the party. What is even better, is that after you get the quick visual, you have the actual values in the plot to work with as well.
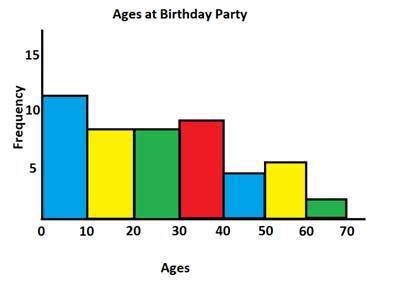
A stem and leaf plot can quickly be turned into a histogram as well to show the data using bars.
Recall that a histogram shows the data in intervals. The intervals would be of size ten.
Part 2: Creating a Stem and Leaf Plot
Here is a set of data on showing the test scores on the last science quiz.
56, 78, 82, 82, 90, 94, 93, 67, 67, 69, 74, 77, 92, 88, 81, 83, 84, 77, 72
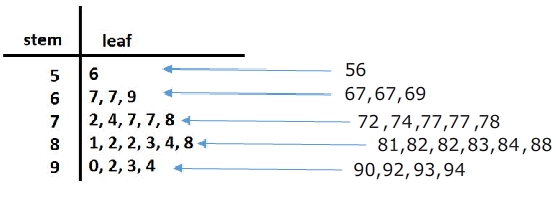
Step 1: In order to create a stem and leaf plot, we need to first organize the data into groups. In this situation, we will group the tests by decades.
56
67, 67, 69
72, 74, 77, 77, 78
81, 82, 82, 83, 84, 88
90, 92, 93, 94
Step 2: Create the plot with the stems as the tens and the leaves as the ones.
The stems will be 5, 6, 7, 8 and 9

Now we are ready to add the ones place from each of the values in the list we made.
Step 3: Add a key to the bottom of the stem and leaf plot.
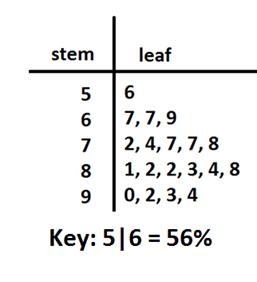
Let's Review: A stem and leaf plot is a great way to organize data by the frequency. It is a great visual that also includes the data. So if needed, you can just take a look to get an idea of the spread of the data or you can use the values to calculate the mean, median or mode.
Related Links:
Math
Fractions
Factors