Measures of Variability : Interquartile Range

Let's look at a couple of examples.
Find the interquartile range of the following data.
Example 1:
1, 7, 0, 7, 2, 6, 3, 6, 0, 7, 8
First make sure that it is in order from least to greatest.
0, 0, 1, 2, 3, 6, 6, 7, 7, 7, 8
Find the median:
Find the middle of the
Find the middle of the
Example 2:
Put in order from least to greatest
find the average
Find the median 1, 1, 4, 5, 5, 5,
 6, 7, 8, 9, 10, 12
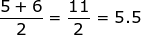
Find Q1 the median of the lower half
1, 1, 4,
 5, 5, 5, 6, 7, 8, 9, 10, 12
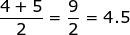
Find Q3the median of the upper half
1, 1, 4,
5, 5, 5, 6, 7, 8, 9, 10, 12 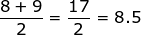

Let's look at an example when given a box and whisker plot.
Min Q1 Med Q3 Max
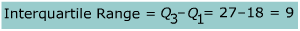
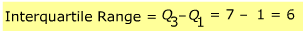
A quick review: to find the interquartile range you will put the data in order from least to greatest then find the median. Once you have found the median Q1is the median of the first half of the data and Q3is the median of the second half of the data.
|
Related Links: Math algebra Measures of Variability : Range Parts of An Expression |
To link to this Measures of Variability : Interquartile Range page, copy the following code to your site: