Creating a Box Plot
Recall that the median is the middle number in a set of data, after the data has been ordered from least to greatest.
Let's check out some examples:
Example #1: Create a box plot that represents the following data.
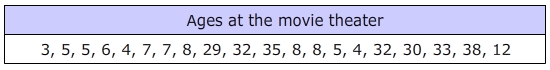
Step 1: Put the data in order from least to greatest.
3, 4, 4, 5, 5, 5, 6, 7, 7, 8, 8, 8, 12, 29, 30, 32, 32, 33, 35, 38
Step 2: Determine the lowest, highest, and median numbers in the data list.
Now that the data is in order, we can easily see that the youngest person was 3, the oldest person was 38.
Now we will find the middle to get the median age.
3, 4, 4, 5, 5, 5, 6, 7, 7, 8, 8, 8, 12, 29, 30, 32, 32, 33, 35, 38
The two middle numbers are 8. Therefore, the median is 8.
Step 3: Determine the value of the upper and lower quartiles.
The lower quartile could also be thought of as the lower median. We will take the lower half of the data and find the median again.

Then we can take the second half of the data and find the middle to get the upper quartile or upper median.

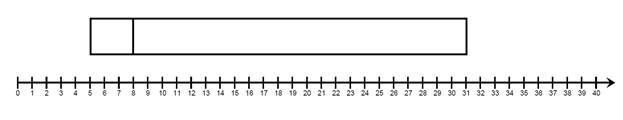
Step 4: Plot the points and create the box and whiskers.
The data ranges from 3 to 38. So we need a number line that goes from about 0 to 40.

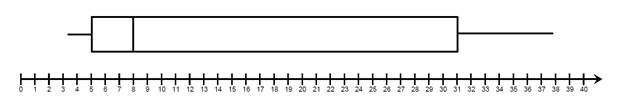
The center box will go from 5 to 31 with a divider at 8.
Then we will add the whiskers from the box. On the left we go out to 3 and on the right we will go out to 38.
Step 5: Add a title.
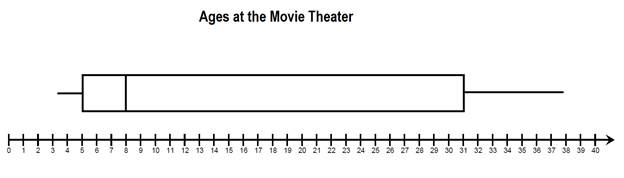
Here is our complete box and whisker plot.
Example #2: Create a box and whisker plot of the math quiz scores.

Let's go through the steps again.
Step 1: Put the values in order.
72, 77, 78, 78, 83, 83, 88, 90, 90, 92, 94, 94, 95
Step 2: The lowest score is 72.
The highest scores is 95.
And the median is 88. 72, 77, 78, 78, 83, 83, 88, 90, 90, 92, 94, 94, 95
Step 3:
In this case, there is only one number in the middle. So we DO NOT reuse it for the upper and lower quartiles.
The lower quartile is 78.72, 77, 78, 78, 83, 83
The upper quartile is 93.90, 90, 92, 94, 94, 95
Step 4:
Create the box plot.
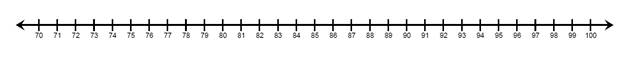
Start with a number line from 70 to 100.
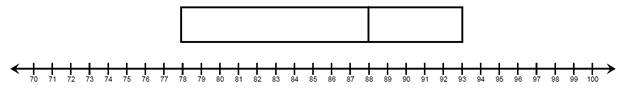
Next, make the box from 78 to 93 with a marker at 88.
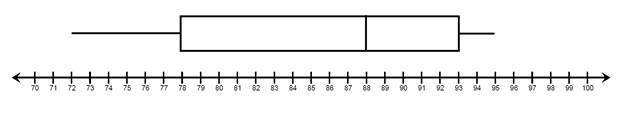
Finally, add the whiskers out to 72 and 95.
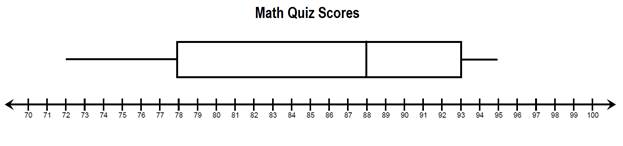
Step 5:
Add the title.
Let's Review:
To make a box plot we need 5 key points.
Minimum
Lower Quartile
Median
Upper Quartile
Maximum
Once these five points are determined, we plot them on a number line. The minimum and maximum form the outside whiskers and attach to the box. The middle three values form the box.
Related Links:
Math
Fractions
Factors