Graphing Parabolas
To graph a parabola...
1. Determine whether it opens up, down, left, or right.
2. Find and plot the vertex
3. Draw the line of symmetry
4. Find and plot more points by substituting values in for x or y.
5. Match those points on the other side of the line of symmetry
6. Draw the parabola.
2. Find and plot the vertex
3. Draw the line of symmetry
4. Find and plot more points by substituting values in for x or y.
5. Match those points on the other side of the line of symmetry
6. Draw the parabola.
Examples:
1. Graph
First we know it is vertical since the x is squared. Since a is negative, it opens down.
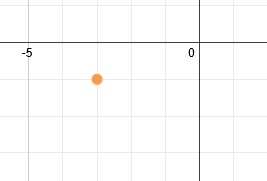
The vertex is (-3, -1). Let's plot that:
The vertex is (-3, -1). Let's plot that:
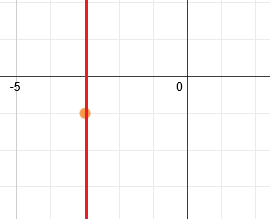
Now we will draw a line of symmetry through this point. Since it is a vertical parabola, the line of symmetry is vertical.
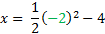
Next, we'll substitute in values for x. We want to choose values that are right next to our line of symmetry but on the same side. So, since our line of symmetry is at x = -3, let's use x = -2 and x = -1.
So, we'll sub -2 in for x and solve for y:
So, we'll sub -2 in for x and solve for y:
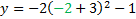

y = -2(1)-1
y = -2-1
y = -3 Coordinate: (-2, -3)
y = -2-1
y = -3 Coordinate: (-2, -3)
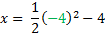
And we'll do the same thing with x = -1:
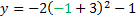

y = -2(4)-1
y = -8-1
y = -9 Coordinate: (-1, -9)
y = -8-1
y = -9 Coordinate: (-1, -9)
And let's plot the two points we found:
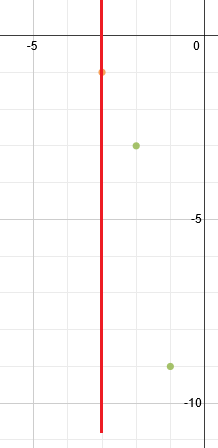
Now, we can use the line of symmetry to find the matching points on the other side. Each point on the right should be mirrored on the left. If it's one space away from the line, there's a matching point one space away on the other side. If it's two spaces away, the matching point is two spaces away, etc. (See below)
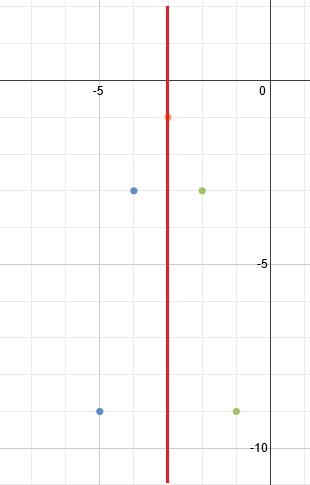
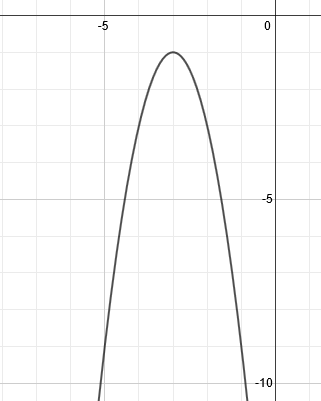
To finish, we simply draw in the parabola.
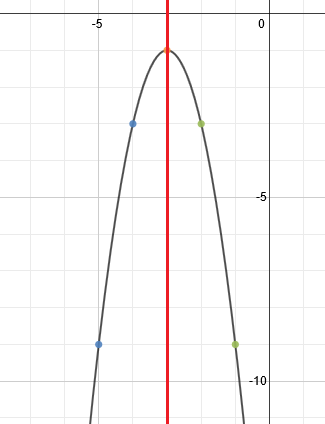
Technically, the line of symmetry is not part of the answer, so a clean graph of the parabola would look like this:
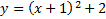
2. Graph
To start, First we know it is horizontal since the y is squared, and since a is positive, it opens to the right.
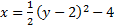
The vertex is (-4, 2). Let's plot that:
The vertex is (-4, 2). Let's plot that:
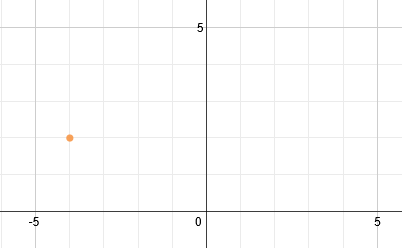
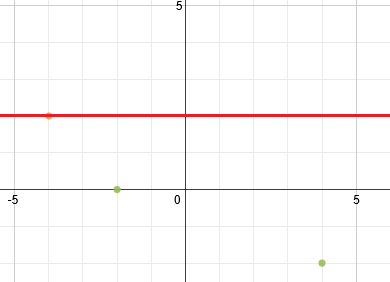
Now we will draw a line of symmetry through this point. Since it is a horizontal parabola, the line of symmetry is horizontal.
Normally we substitute in values for x. We could do this, but that would require us to rearrange the equation. Instead, we can substitute in values for y.
We want to choose values that are right next to our line of symmetry but on the same side. So, since our line of symmetry is at y = 2, we would use y = 1 and y = 0. However, if we use 1, we're going to get a fraction, so let's skip this value and use y = 0.
Let's sub 0 in for y and solve for x:
We want to choose values that are right next to our line of symmetry but on the same side. So, since our line of symmetry is at y = 2, we would use y = 1 and y = 0. However, if we use 1, we're going to get a fraction, so let's skip this value and use y = 0.
Let's sub 0 in for y and solve for x:
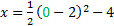

x = 2-4
x = -2 Coordinate: (-2, 0)
x = -2 Coordinate: (-2, 0)
If we use y = -1 we'll get a fraction again, so let's use y = -2
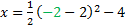

x = 8-4
x = 4 Coordinate: (4, -2)
x = 4 Coordinate: (4, -2)
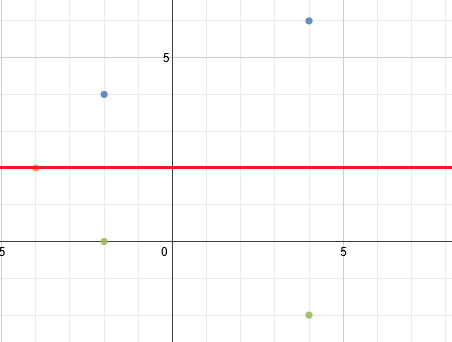
And let's plot the two points we found:
Now, we can use the line of symmetry to find the matching points on the other side. Remember that point on the bottom should be mirrored on the top.
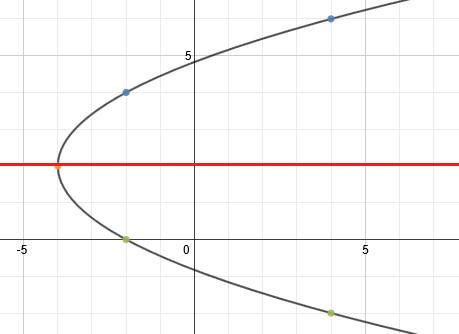
To finish, we simply draw in the parabola.
Practice: Graph each parabola
1. 
2.
3.
4.
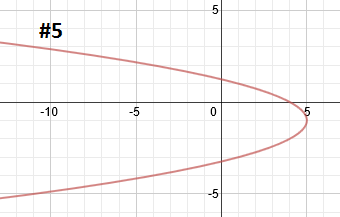
5.
2.
3.
4.
5.
Answers:
|
Related Links: Math Fractions Factors |