Graphing Hyperbolas
Remember the two patterns for hyperbolas:

To graph a hyperbola....
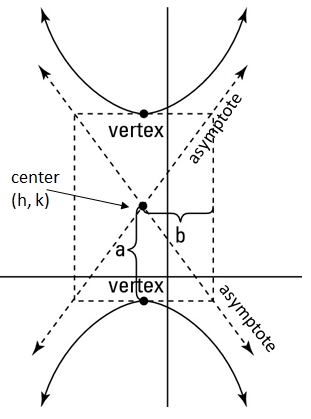
1. Determine if it is horizontal or vertical. Find the center point, a, and b.
2. Graph the center point.
3. Use the a value to find the two vertices.
4. Use the b value to draw the guiding box and asymptotes.
5. Draw the hyperbola.
Examples:

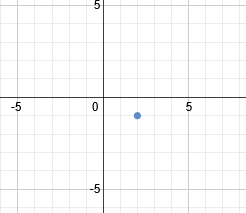
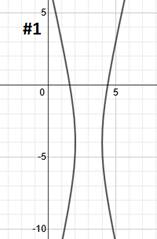
First, we know this is horizontal since the x is positive. That means the hyperbola will open to the left and right. The center point is (2, -1). a = 2, b = 3
The center is (2, -1). Let's plot that point:
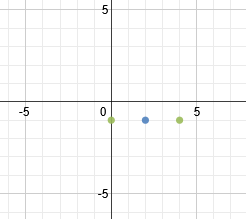
Next we will use our a value to find our two vertices. a = 2. Since the hyperbola is horizontal, we must count 2 spaces to the left and right of our center point. That will be the location of our vertices.
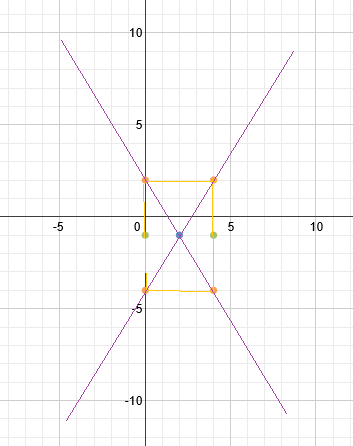
Next, we'll use the b value to draw in a guiding box. b = 3, so we will count up 3 and down 3 from both vertices. This will give us the 4 corners of our guiding box.
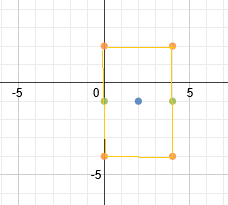
We can now draw our 2 asymptotes diagonally through the corners of the box:
Finally, we draw in our hyperbola. Each half starts at the vertex and continues towards the asymptotes but never actually reaches them.
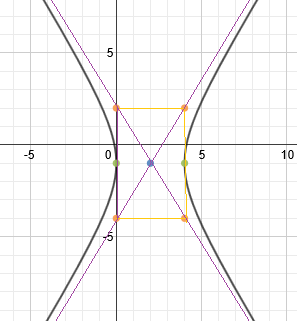
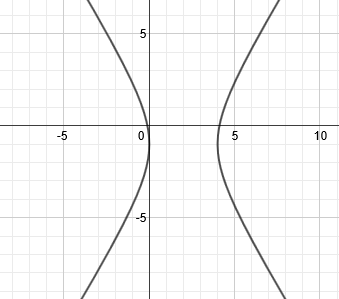
The center point, guiding box, and asymptotes are not technically part of the answer, so a clean version of the graph would look like this:
The center is (2, -1). Let's plot that point:
Next we will use our a value to find our two vertices. a = 2. Since the hyperbola is horizontal, we must count 2 spaces to the left and right of our center point. That will be the location of our vertices.
Next, we'll use the b value to draw in a guiding box. b = 3, so we will count up 3 and down 3 from both vertices. This will give us the 4 corners of our guiding box.
We can now draw our 2 asymptotes diagonally through the corners of the box:
Finally, we draw in our hyperbola. Each half starts at the vertex and continues towards the asymptotes but never actually reaches them.
The center point, guiding box, and asymptotes are not technically part of the answer, so a clean version of the graph would look like this:

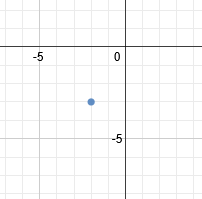
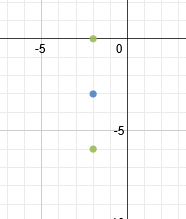
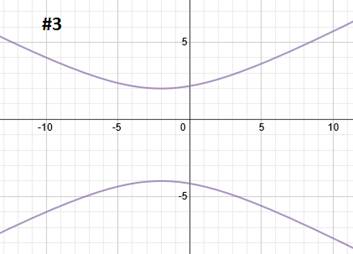
First, we know this is vertical since the y is positive. That means the hyperbola will open up and down. The center point is (-2, -3). a = 3, b = 1
The center is (-2, -3). Let's plot that point:
Next we will use our a value to find our two vertices. a = 3. Since the hyperbola is vertical, we must count 3 spaces up and down from our center point. That will be the location of our vertices.
Next, we'll use the b value to draw in a guiding box. b = 1, so we will count left 1 and right 1 from both vertices. This will give us the 4 corners of our guiding box.
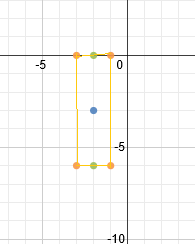
We can now draw our 2 asymptotes diagonally through the corners of the box:
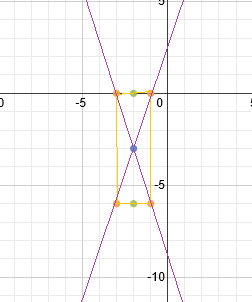
Finally, we draw in our hyperbola. Each half starts at the vertex and continues towards the asymptotes but never actually reaches them.
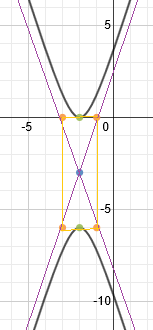
Practice: Graph each hyperbola.The center is (-2, -3). Let's plot that point:
Next we will use our a value to find our two vertices. a = 3. Since the hyperbola is vertical, we must count 3 spaces up and down from our center point. That will be the location of our vertices.
Next, we'll use the b value to draw in a guiding box. b = 1, so we will count left 1 and right 1 from both vertices. This will give us the 4 corners of our guiding box.
We can now draw our 2 asymptotes diagonally through the corners of the box:
Finally, we draw in our hyperbola. Each half starts at the vertex and continues towards the asymptotes but never actually reaches them.


Answers:
|
Related Links: Math Fractions Factors |