Normal Distribution - Real-World Problems Using z Values
Now that you can calculate probabilities using a z table, it is time to use this knowledge to solve real-world problems. We again use IQ scores, with a mean of 100 and a standard deviation of 15, to calculate some probabilities.
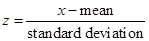
For example, suppose you know that your IQ is 120. You might wonder how this score compares to other individuals' IQ scores. It is now a relatively easy procedure. We first introduce what is called the conversion formula. We will convert from IQ scores to z scores. We know how to determine probabilities for z scores, so if we know the z score for a particular IQ score, we can also calculate a probability for that IQ score. To convert from an IQ score to a z score, we use the formula:
 In this conversion formula, the "x" value is the IQ score of interest (in
this case 120), the mean will be 100, and the standard deviation will be 15. Let's calculate the z score for your IQ of 120:
In this conversion formula, the "x" value is the IQ score of interest (in
this case 120), the mean will be 100, and the standard deviation will be 15. Let's calculate the z score for your IQ of 120:
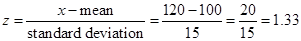 The z score for your IQ of 120 is 1.33.
Now, we use the z table to find the percent (or probability) that a person would have an IQ of 120 or less, which is the same as the percent (or probability) that a z score is 1.33 or less.
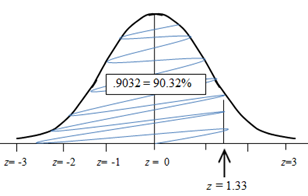
We look up a z value of 1.33, and we find that the probability that z is 1.33 or less is .9032. This means that about 90 % of people will score at or below an IQ of 120. This also means that only about 10% of people will score higher than your IQ score of 120.
Another example comes from biology. Say that you know that a particular species of insect has a mean length of 12 inches, with a standard deviation of 2 inches. You want to find the probability that a randomly-selected insect of this species will have a length greater than 13.5 inches.
First note that the x value, which is the value of interest, is 13.5. Now remember that the mean and standard deviation are 12 and 2, respectively. Plug these numbers into the conversion formula to get the z value:
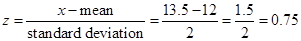 The z score for 13.5 inches is 0.75. Sketch a
bell curve with the z score of 0.75, and shade the region to the right of the score, because you want the probability that an insect will be greater than 13.5 inches (a z score of 0.75).
The z score for 13.5 inches is 0.75. Sketch a
bell curve with the z score of 0.75, and shade the region to the right of the score, because you want the probability that an insect will be greater than 13.5 inches (a z score of 0.75).
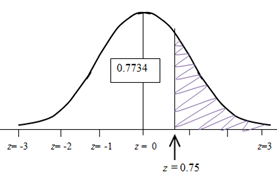
Using the z table, we see that the probability to the left of a z score of 0.75 is .7734, but remember that we want the probability to its right. We therefore subtract the .7734 from 1 to get the area of the shaded region: 1 - .7734 = .2266. The probability that a z score is greater than 0.75 is .2266, and this is also the probability that a randomly-selected insect of this species will be more than 13.5 inches long.
You now see that z scores and their associated probabilities can be used to determine many real-world probabilities. The only things you need we need to know are the mean and standard deviation of a normally-distributed variable, such as IQ score, insect length, heights of females, or SAT scores.
For example, suppose you know that your IQ is 120. You might wonder how this score compares to other individuals' IQ scores. It is now a relatively easy procedure. We first introduce what is called the conversion formula. We will convert from IQ scores to z scores. We know how to determine probabilities for z scores, so if we know the z score for a particular IQ score, we can also calculate a probability for that IQ score. To convert from an IQ score to a z score, we use the formula:
In this conversion formula, the "x" value is the IQ score of interest (in
this case 120), the mean will be 100, and the standard deviation will be 15. Let's calculate the z score for your IQ of 120:The z score for your IQ of 120 is 1.33.Now, we use the z table to find the percent (or probability) that a person would have an IQ of 120 or less, which is the same as the percent (or probability) that a z score is 1.33 or less.
We look up a z value of 1.33, and we find that the probability that z is 1.33 or less is .9032. This means that about 90 % of people will score at or below an IQ of 120. This also means that only about 10% of people will score higher than your IQ score of 120.
Another example comes from biology. Say that you know that a particular species of insect has a mean length of 12 inches, with a standard deviation of 2 inches. You want to find the probability that a randomly-selected insect of this species will have a length greater than 13.5 inches.
First note that the x value, which is the value of interest, is 13.5. Now remember that the mean and standard deviation are 12 and 2, respectively. Plug these numbers into the conversion formula to get the z value:
The z score for 13.5 inches is 0.75. Sketch a
bell curve with the z score of 0.75, and shade the region to the right of the score, because you want the probability that an insect will be greater than 13.5 inches (a z score of 0.75).Using the z table, we see that the probability to the left of a z score of 0.75 is .7734, but remember that we want the probability to its right. We therefore subtract the .7734 from 1 to get the area of the shaded region: 1 - .7734 = .2266. The probability that a z score is greater than 0.75 is .2266, and this is also the probability that a randomly-selected insect of this species will be more than 13.5 inches long.
You now see that z scores and their associated probabilities can be used to determine many real-world probabilities. The only things you need we need to know are the mean and standard deviation of a normally-distributed variable, such as IQ score, insect length, heights of females, or SAT scores.
|
Related Links: Math Probability and Statistics Scatterplot Contingency Table |
To link to this Normal Distribution - Real-World Problems Using z Values page, copy the following code to your site: